- High Conviction
- Broadcap
High Conviction Fund Performance
Fund Performance (Gross) as at 30 September 2025
| . | 3 months (%) | 1 year (%) | 3 years (%) p.a. | 5 years (%) p.a. | 10 years (%) p.a. | 15 years (%) p.a. | Since inception (%) p.a.* | |||
|---|---|---|---|---|---|---|---|---|---|---|
| Greencape High Conviction Fund | Fund | Gross Return | 3.35 | 3.03 | 14.78 | 12.60 | 11.59 | 10.78 | 10.76 | 1 |
| Greencape High Conviction Fund | ActiveReturn | Gross Active | -1.36 | -7.53 | -0.38 | -0.38 | 1.48 | 1.87 | 3.35 | 2 |
| Greencape High Conviction Fund | Fund | Net Return | 3.11 | 2.10 | 13.73 | 11.54 | 10.41 | 9.61 | 9.51 | 3 |
| Greencape High Conviction Fund | ActiveReturn | Net Active | -1.60 | -8.46 | -1.44 | -1.45 | 0.30 | 0.70 | 2.09 | 4 |
| S&P/ASX 200 Accumulation Index | Benchmark | Gross Return | 4.71 | 10.56 | 15.16 | 12.98 | 10.11 | 8.91 | 7.42 | 5 |
* Inception date is 11 September 2006. Returns are calculated before fees have been deducted, assuming reinvestment of distributions. No allowance is made for tax. Past performance is not a reliable indicator of future performance.
**Numbers may not add due to rounding.
**Numbers may not add due to rounding.
Fund Performance (Net) as at 30 September 2025
| . | 3 months (%) | 1 year (%) | 3 years (%) p.a. | 5 years (%) p.a. | 10 years (%) p.a. | 15 years (%) p.a. | Since inception (%) p.a.* | |||
|---|---|---|---|---|---|---|---|---|---|---|
| Greencape High Conviction Fund | Fund | Gross Return | 3.35 | 3.03 | 14.78 | 12.60 | 11.59 | 10.78 | 10.76 | 1 |
| Greencape High Conviction Fund | ActiveReturn | Gross Active | -1.36 | -7.53 | -0.38 | -0.38 | 1.48 | 1.87 | 3.35 | 2 |
| Greencape High Conviction Fund | Fund | Net Return | 3.11 | 2.10 | 13.73 | 11.54 | 10.41 | 9.61 | 9.51 | 3 |
| Greencape High Conviction Fund | ActiveReturn | Net Active | -1.60 | -8.46 | -1.44 | -1.45 | 0.30 | 0.70 | 2.09 | 4 |
| S&P/ASX 200 Accumulation Index | Benchmark | Gross Return | 4.71 | 10.56 | 15.16 | 12.98 | 10.11 | 8.91 | 7.42 | 5 |
* Inception date is 11 September 2006. Returns are calculated before fees have been deducted, assuming reinvestment of distributions. No allowance is made for tax. Past performance is not a reliable indicator of future performance.
**Numbers may not add due to rounding.
**Numbers may not add due to rounding.
Performance Graph
Performance of $10,000 invested since inception (net of fees)*
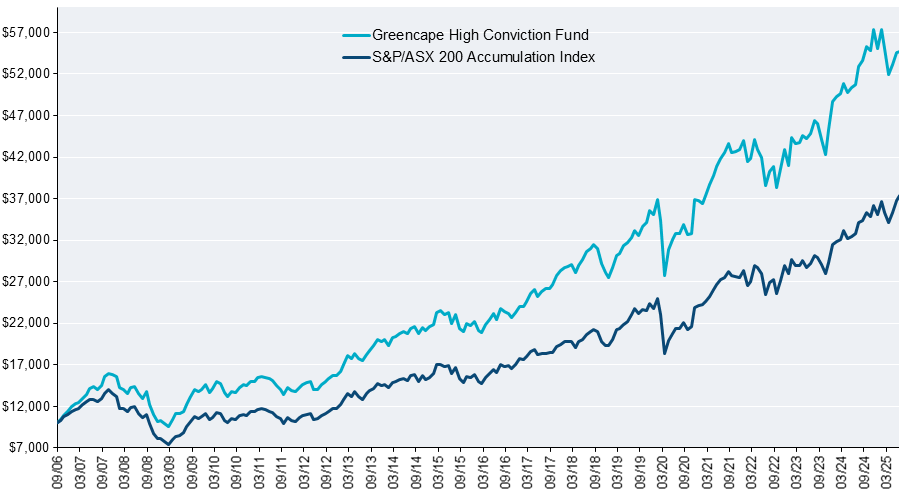
* As at 30 June 2025. Inception date is 11 September 2006. Returns are calculated after fees have been deducted, assuming reinvestment of distributions. No allowance is made for tax. Past performance is not a reliable indicator of future performance. Active returns are calculated using net performance.
Unit Prices and Distributions
To view historical unit prices and distributions click here
Broadcap Fund Performance
Fund Performance (Gross) as at 30 September 2025
| . | 3 months (%) | 1 year (%) | 3 years (%) p.a. | 5 years (%) p.a. | 10 years (%) p.a. | 15 years (%) p.a. | Since inception (%) p.a.* | |||
|---|---|---|---|---|---|---|---|---|---|---|
| Greencape Broadcap Fund | Fund | Gross Return | 3.23 | 3.40 | 13.98 | 11.24 | 11.76 | 11.16 | 10.87 | 1 |
| Greencape Broadcap Fund | ActiveReturn | Gross Active | -1.76 | -7.35 | -1.05 | -1.63 | 1.65 | 2.34 | 3.53 | 2 |
| Greencape Broadcap Fund | Fund | Net Return | 2.98 | 2.42 | 12.90 | 10.20 | 10.46 | 9.84 | 9.42 | 3 |
| Greencape Broadcap Fund | ActiveReturn | Net Active | -2.01 | -8.33 | -2.12 | -2.68 | 0.35 | 1.01 | 2.07 | 4 |
| S&P/ASX 300 Accumulation Index | Benchmark | Gross Return | 4.99 | 10.76 | 15.02 | 12.88 | 10.11 | 8.82 | 7.35 | 5 |
* Inception date is 11 September 2006. Returns are calculated before fees have been deducted, assuming reinvestment of distributions. No allowance is made for tax. Past performance is not a reliable indicator of future performance.
**Numbers may not add due to rounding.
**Numbers may not add due to rounding.
Fund Performance (Net) as at 30 September 2025
| . | 3 months (%) | 1 year (%) | 3 years (%) p.a. | 5 years (%) p.a. | 10 years (%) p.a. | 15 years (%) p.a. | Since inception (%) p.a.* | |||
|---|---|---|---|---|---|---|---|---|---|---|
| Greencape Broadcap Fund | Fund | Gross Return | 3.23 | 3.40 | 13.98 | 11.24 | 11.76 | 11.16 | 10.87 | 1 |
| Greencape Broadcap Fund | ActiveReturn | Gross Active | -1.76 | -7.35 | -1.05 | -1.63 | 1.65 | 2.34 | 3.53 | 2 |
| Greencape Broadcap Fund | Fund | Net Return | 2.98 | 2.42 | 12.90 | 10.20 | 10.46 | 9.84 | 9.42 | 3 |
| Greencape Broadcap Fund | ActiveReturn | Net Active | -2.01 | -8.33 | -2.12 | -2.68 | 0.35 | 1.01 | 2.07 | 4 |
| S&P/ASX 300 Accumulation Index | Benchmark | Gross Return | 4.99 | 10.76 | 15.02 | 12.88 | 10.11 | 8.82 | 7.35 | 5 |
* Inception date is 11 September 2006. Returns are calculated before fees have been deducted, assuming reinvestment of distributions. No allowance is made for tax. Past performance is not a reliable indicator of future performance.
**Numbers may not add due to rounding.
**Numbers may not add due to rounding.
Performance Graph
Performance of $10,000 invested since inception (net of fees)*
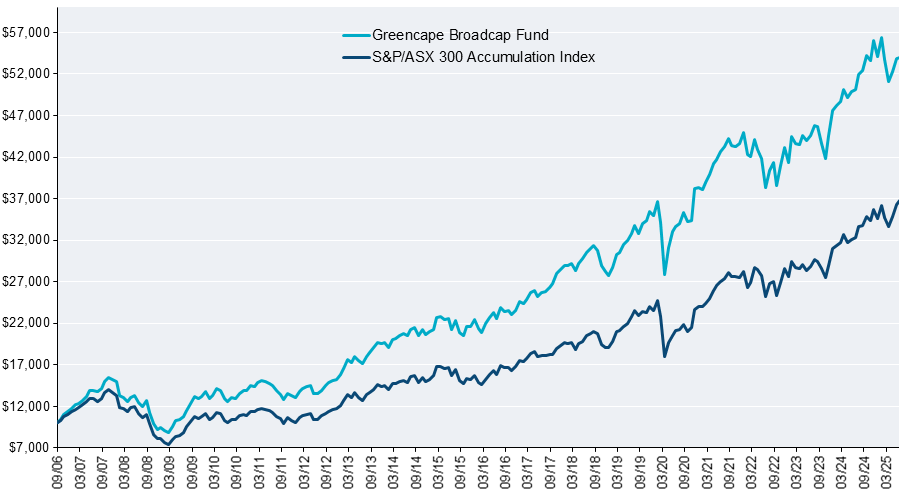
* As at 30 June 2025. Inception date is 11 September 2006. Returns are calculated after fees have been deducted, assuming reinvestment of distributions. No allowance is made for tax. Past performance is not a reliable indicator of future performance. Active returns are calculated using net performance.
Unit Prices and Distributions
To view historical unit prices and distributions click here